P2P insights: How purchase order metrics impact procurement KPIs

Unlock the power of your procure-to-pay (P2P) data.
Amazon’s 2024 State of Procurement Data Report revealed that 98% of procurement leaders are investing in analytics and insights tools, automation, and AI. But are they getting the most out of these tools?
To truly optimize your P2P cycle, you need to go beyond simply collecting data. This article provides a framework for understanding how specific accounts payable (AP) and purchase order (PO) metrics directly influence your high-level procurement KPIs. You’ll learn how to leverage these insights to improve procurement performance, save money, and strengthen your supply chain.
Ready to move beyond basic procurement reporting and understand the KPIs that drive P2P performance? Let’s dive into the key metrics that define a successful procurement process.
High-level procurement KPIs and metrics
Procurement KPIs let you evaluate the effectiveness and efficiency of your P2P cycle. They are your procurement department’s vital signs, offering valuable insights into its health and performance.
We’ll focus on three areas of procurement management:
- Efficiency and accuracy: How quickly and accurately does your P2P process flow from purchase requisition to vendor payment?
- Spending and cost savings: Do you have a good handle on spending? Are you maximizing cost savings through negotiations, compliance, and spend management?
- Supplier performance: Are your suppliers meeting your expectations with on-time delivery, quality, pricing, and responsiveness?
Let’s take a closer look at each of these areas and the specific KPIs that provide the most valuable insights.
1. Efficiency and accuracy
Efficiency and accuracy are the cornerstones of an effective P2P process. An efficient process is fast with minimal unnecessary steps or rework. Maintaining a high level of accuracy is crucial to avoid costly errors that can delay shipments, cause late payments, and damage supplier relationships. To assess accuracy and efficiency, track these KPIs:
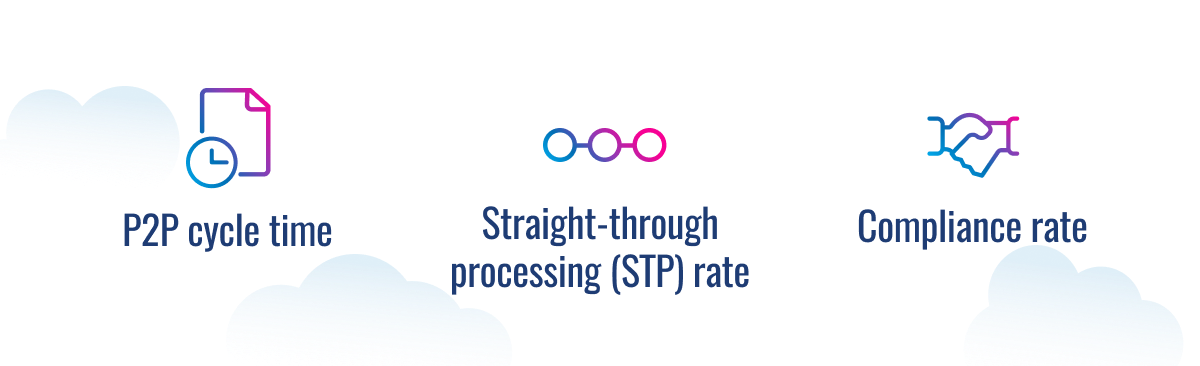
P2P cycle time
P2P cycle time is the amount of time it takes to complete a purchase from requisition to payment. It’s a key measure of procurement efficiency. We can divide the P2P cycle into two components:
- PO cycle time: The time from requisition to invoice
- AP cycle time: The time from invoice to final payment
A high P2P cycle time can indicate process inefficiencies in these two cycles.
Straight-through processing rate
The straight-through processing (STP) rate measures the percentage of purchases that flow through the procurement cycle without manual intervention. It helps you evaluate the efficiency and effectiveness of P2P automation technologies.
A high STP rate means your P2P processes are highly automated with minimal manual intervention.
Compliance rate (Internal and external)
The compliance rate measures the percentage of transactions that comply with rules, policies, regulations, and contracts. It includes:
- Internal compliance: Following procurement policies, approval workflows, spending limits, and preferred supplier lists.
- External compliance: Suppliers adhere to contract terms and relevant laws and regulations like environmental sustainability or safety standards.
A low compliance rate may indicate these rules aren’t being followed, which can put your business at risk of delays, financial losses, or penalties.
2. Spending and cost savings
Spending and cost savings KPIs measure how much visibility and control your procurement department has over expenditures and how effectively it’s driving cost reductions and maximizing value. These KPIs demonstrate the financial impact of procurement and its contribution to the bottom line.

Spend under management
Spending under management measures the percentage of total spending your procurement department manages. A low spend under management rate indicates procurement has poor control over expenditures.
Cost savings from procurement
Cost savings from procurement track the cost reductions achieved through negotiation, strategic sourcing, demand management, and contract management. To effectively measure this KPI, start from a baseline (previous year’s spending, industry benchmark) and track the difference between the baseline and the actual costs incurred.
3. Supplier performance
Supplier performance KPIs measure the reliability, quality, cost-effectiveness, and overall value provided by your suppliers. They let you identify top performers, proactively address delivery or quality issues, and build stronger, more collaborative supplier relationships.
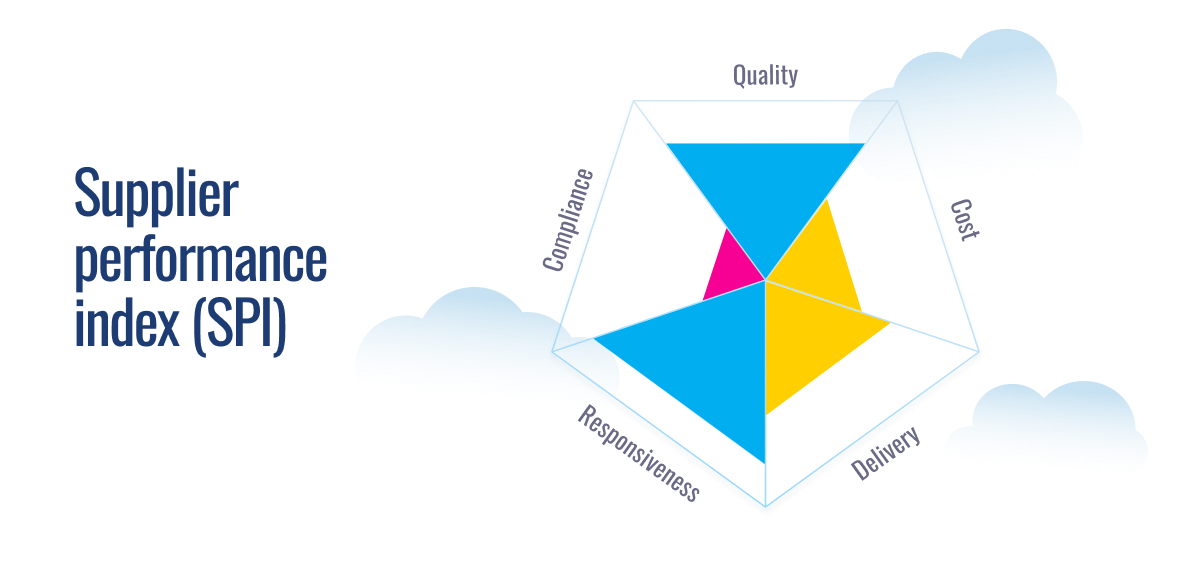
Supplier performance index (SPI)
The supplier performance index consolidates supplier performance criteria into a single, quantifiable score. It lets you objectively measure and evaluate supplier performance across different categories.
The SPI is different for every company, but it usually contains a weighted average of performance metrics such as:
- On-time delivery: Percentage of orders delivered by the delivery date
- Quality: percentage of defect-free goods or services received
- Responsiveness: How often the supplier addressed inquiries or resolved issues promptly
- Cost: Competitiveness of pricing and adherence to agreed-up pricing
- Compliance: Supplier’s adherence to contractual obligations and regulations
These KPIs act as an early warning system, alerting you to potential problems in your P2P process. But to pinpoint and address the source of those problems you need to drill down into the underlying AP and PO metrics. Think of it this way: the KPIs tell you what’s wrong, and the metrics tell you where it’s wrong.
Each KPI is influenced by a set of underlying metrics. By analyzing these metrics for trends, outliers, and deviations from targets, you can gain actionable insights into areas for improvement. In the following two sections, we’ll define each metric, show how it’s calculated, and explain how it affects the P2P KPIs.
Purchase order metrics and how they affect procurement performance
Here’s a breakdown of the specific PO metrics that measure process performance from purchase requisition to invoice.
Shadow/maverick spending
Maverick spending is when employees or departments circumvent the purchasing process to make a purchase.
Formula
Maverick spending = Total spending – spending through approved contracts/channels
Impact on KPIs
- Efficiency and accuracy: Maverick spending can result in delays or incorrect orders, negatively impacting P2P efficiency.
- Spending and cost savings: Because it happens without procurement oversight and outside approved budgets, high maverick spending can reduce spend under management and cost savings from procurement.
- Supplier performance: Maverick spending with existing suppliers can increase disputes and damage relationships. It can also result in transactions with non-approved vendors.
Supplier defect rate
The supplier defect rate is the percentage of goods or services that are defective or don’t meet quality standards.
Formula
Supplier defect rate = (Number of defective items/Total number of items received) X 100
Impact on KPIs
- Efficiency and accuracy: A high defect rate can indicate the company is sending erroneous POs. It can also lead to delays due to returns/restocking.
- Spending and cost savings: Increased costs for returns, replacement, or disposal of unwanted items can reduce cost savings.
- Supplier performance: Chronically high defect rates could indicate problems with a supplier’s quality control.
On-time delivery
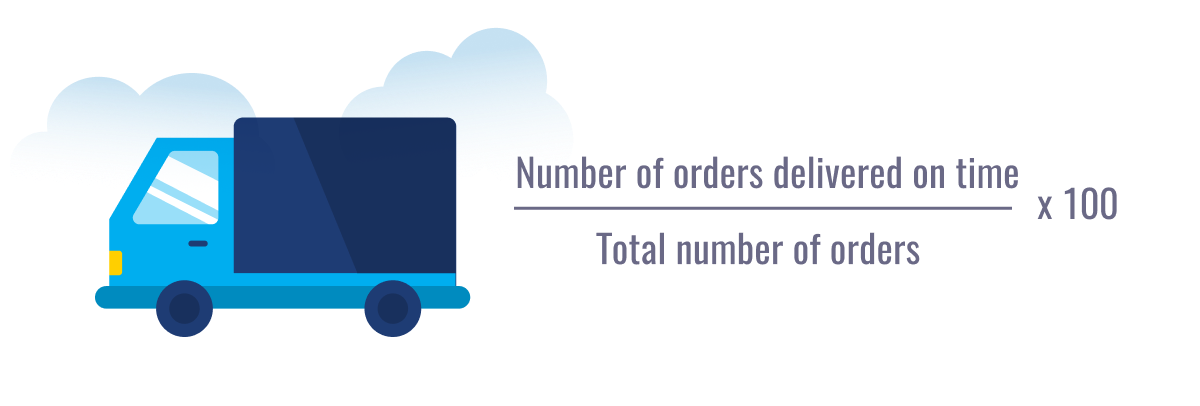
On-time delivery measures the percentage of times the supplier delivers the good or service on or before the agreed delivery date.
Formula
On-time delivery = (Number of orders delivered on time/Total number of orders) X 100
Impact on KPIs
- Efficiency and accuracy: A high on-time delivery rate positively impacts the P2P cycle time and indicates good communication between purchasers and suppliers.
- Supplier performance: A high on-time delivery rate is a positive indicator of a supplier’s performance. A low rate may indicate communications or shipping issues.
Cost per unit and cost variance
Cost per unit measures the average cost of each unit of goods or services the company has purchased. Cost variance is the difference between the cost per unit and the average market cost.
Formula
Cost per unit of good X = Total cost of good X shipments/Total units of good X
Cost variance = Cost per unit of good X – Market cost per unit of good X
Impact on KPIs
- Spending and cost savings: A high positive cost variance indicates your company may be paying higher than market prices for the good. A high negative variance means you may be paying under-market prices.
- Supplier performance: Cost variance can indicate a supplier’s pricing competitiveness.
Cost per PO
The cost per PO is the total administrative cost of creating and processing a purchase order.
Formula
Cost per PO = Total PO processing costs/Total number of POs
Impact on KPIs
- Efficiency and accuracy: A high cost per PO can reveal inefficiencies in your PO processes such as manual tasks or a high revision/error rate.
- Spending and cost savings: The cost per PO is a significant component of your procurement operating costs. If it’s high, it can eat into cost savings.
PO per full-time equivalent (FTE)
PO per full-time equivalent is the number of purchase orders processed per full-time equivalent procurement employee.
Formula
PO per FTE = Total number of POs processed/Number of FTE procurement staff processing POs
Impact on KPIs
- Efficiency and accuracy: PO per FTE is a key measure of employee productivity and directly impacts how quickly your procurement team processes POs.
PO aging
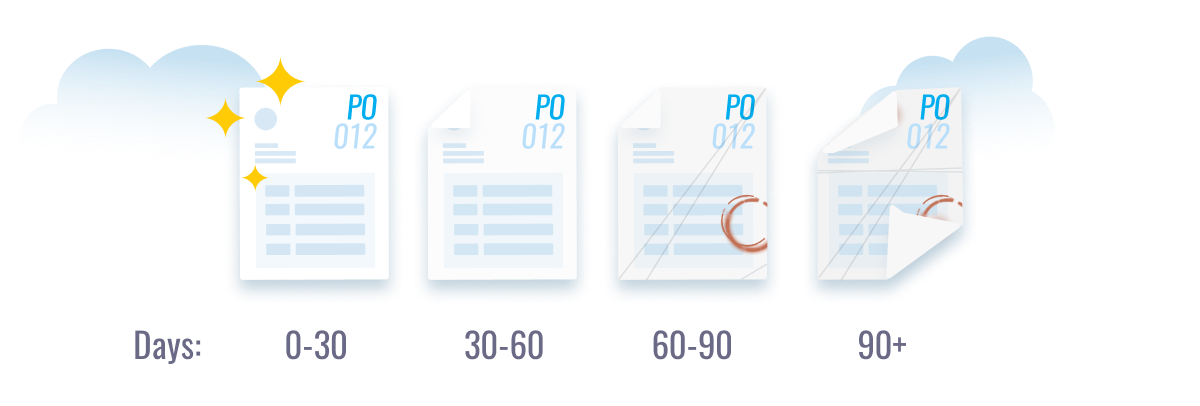
PO aging is the length of time a purchase order remains open or outstanding. It is usually grouped by 0-30, 30-60, 60-90, and 90+ days.
Formula
PO aging = length of time (days/weeks) since a PO was issued to a supplier
Impact on KPIs
- Efficiency and accuracy: PO aging indicates how quickly vendors process POs and deliver goods and services. A large number of delayed POs can indicate a supplier is having trouble delivering on time. It may also reflect the failure of the procurement team to escalate the overdue deliveries with the supplier.
- Supplier performance: PO aging can gauge a supplier’s responsiveness and ability to deliver. A large number of POs in the 0-30 category can indicate a responsive supplier that delivers on time.
AP metrics and how they impact the procurement process
Here are the accounts payable metrics that measure process efficiency from invoice to final payment and how they can influence P2P KPIs.
AP turnover rate
The AP turnover rate measures how many times a company pays off its accounts payable during a period of time.
Formula
AP turnover rate = Total purchases/Average accounts payable*
*Average accounts payable = (Beginning AP balance + Ending AP balance)/2
Impact on KPIs
- Efficiency and accuracy: A high AP turnover rate indicates your company pays its bills quickly or on time, positively affecting the P2P cycle time.
- Supplier performance: Because it measures how often your company pays suppliers, the AP turnover rate can indicate the health of vendor relationships. A low rate indicates your business is slow to pay vendors, which may be putting strain on vendors.
Days Payable Outstanding (DPO)
DPO is the average number of days it took your company to pay its suppliers during a period of time.
Formula
Days payable outstanding = Number of days in period/AP turnover rate
Impact on KPIs
- Efficiency and accuracy: A low DPO means your company is paying vendors quickly, reducing P2P cycle time.
- Supplier performance: As with the AP turnover rate, DPO is an important metric for gauging vendor relationships. A low DPO can mean you’re paying vendors on time, likely improving vendor relationships.
First-time match rate
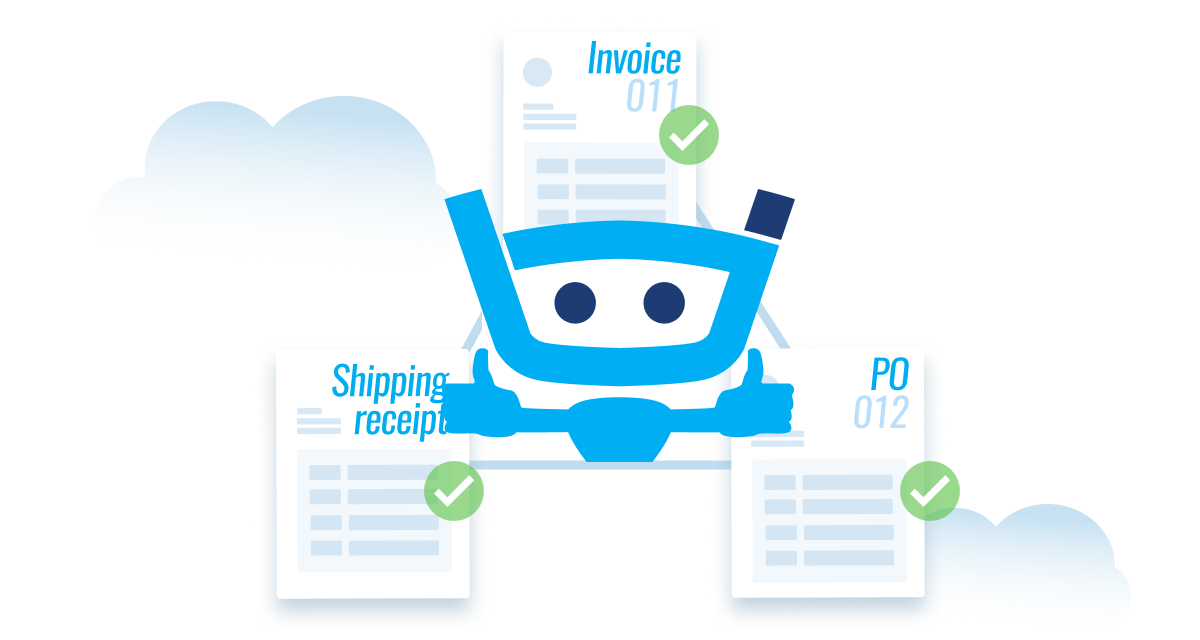
The first-time match (FTM) rate is the percentage of invoices successfully matched to POs and goods receipts on the first attempt during three-way matching.
Formula
First-time match rate = (Number of invoices matched on first attempt/Total number of invoices) X 100
Impact on KPIs
Efficiency and accuracy: A high FTM rate can indicate that POs, invoices, and shipping receipts are accurate and clear; there is good communication with suppliers; and suppliers are delivering what was promised.
Invoice accuracy rate
The invoice accuracy rate is the percentage of invoices that are error-free.
Formula
Invoice accuracy rate = (Number of error-free invoices/total number of invoices) X 100
Impact on KPIs
- Efficiency and accuracy: Inaccurate invoices disrupt the P2P process, causing delays as employees investigate and correct errors. They can also lead to delayed payments to suppliers.
- Spending and cost savings: Your company may inadvertently pay an erroneous invoice, resulting in additional costs.
- Supplier performance: Inaccurate invoices can indicate your POs are not complete and accurate, poor communication with suppliers, or fraudulent activity by a supplier.
Negotiated discounts captured rate
The negotiated discounts captured rate is the percentage of negotiated discounts the company successfully captures.
Formula
Negotiated discounts captured rate = (Total value of discounts captured/Total value of discounts offered) x 100
Impact on KPIs
Spending and cost savings: A high negotiated discounts captured rate indicates the company is taking advantage of discounts negotiated by procurement. It can also indicate a high level of coordination between procurement and accounts payable.
Invoices per FTE
Invoices per FTE measures the number of invoices processed per full-time equivalent accounts payable employees.
Formula
Invoices per FTE = (Total number of invoices processed/Number of AP staff processing invoices)
Impact on KPIs
Efficiency and accuracy: A high invoices per FTE metric indicates high labor productivity and efficient invoice processing. It’s also a good measure to gauge the impact of AP automation on productivity.
Cost per invoice
Cost per invoice is the average operational cost of processing an invoice in accounts payable.
Formula
Cost per invoice = Total invoice processing costs/Total number of invoices
Impact on KPIs
Efficiency and accuracy: A high cost per invoice can indicate inefficiencies in AP processing or a reliance on manual tasks.
Next steps: optimizing AP and PO metrics
Now that you have a better understanding of the link between AP and PO metrics and high-level P2P KPIs, let’s look at how to optimize the data for better results.
Choose and prioritize the right metrics
Focus on the metrics that are aligned with your company’s strategy and challenges. For example, if your goal is to improve visibility and control over spending, you should drill down into metrics like maverick spending and cost variance.
Benchmark against industry data
Check your performance by comparing your KPIs and metrics against competitors and others in your sector.
Improve and standardize PO and AP processes
Manual processes are inefficient, inaccurate, and difficult to measure, impairing your ability to track performance and identify areas for improvement. Standardize workflows, automate key tasks, and centralize data for better visibility and control. This will improve accuracy and let you measure PO and AP metrics more effectively.
Leverage PO and AP automation software
Finance operations platforms can streamline PO and AP processes and provide real-time visibility into key metrics. Solutions like Stampli can significantly boost first-time match rates and improve P2P efficiency.
Transform your P2P (and boost your KPIs) with Stampli
Stampli Procure-to-Pay automates and optimizes your P2P processes. It provides the insight and control you need to improve efficiency, manage spending, reduce costs, and make smarter financial decisions.
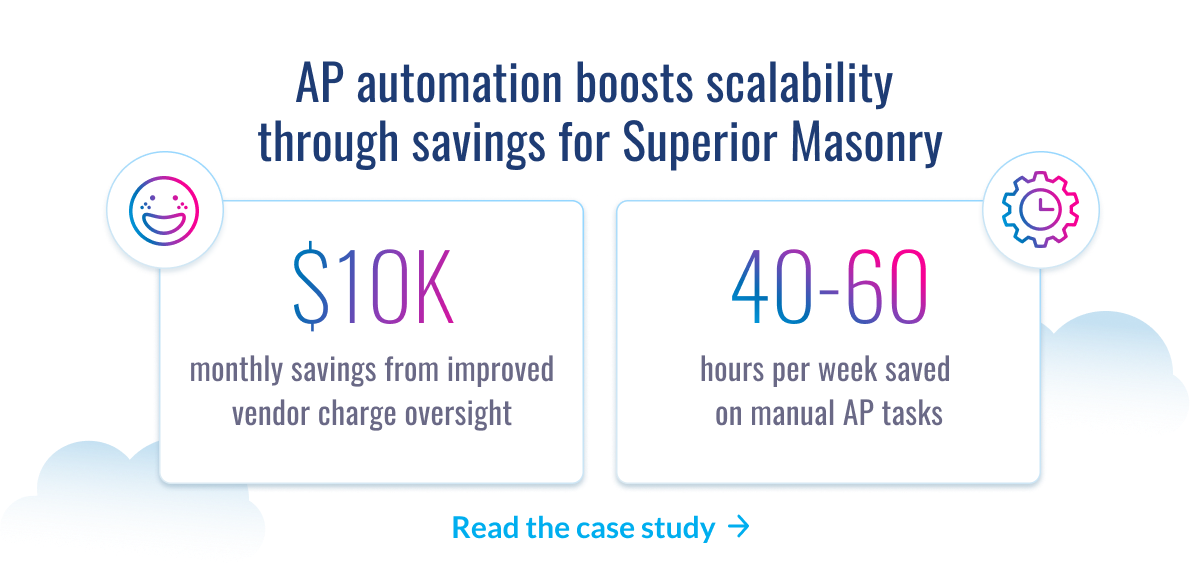
Superior Masonry saw incredible results with Stampli, achieving a 100% PO match rate and 93% faster invoice processing.
Contact Stampli today to learn how you can achieve similar results by unlocking the full potential of your P2P processes.