Your budget process is thorough. Category owners submit requests. Finance reviews assumptions. Leadership approves. The numbers go into the system.
Six months later, actual spend is running meaningfully above plan across multiple categories, and no one made a decision that explains it.
Cost Creep Doesn’t Announce Itself
Cost creep is what happens when vendor spend rises gradually without a single approved decision driving it. It’s not fraud. It’s not a budget failure. It’s the accumulated result of individual invoices, each reasonable on its own, that collectively push spend above plan over weeks and months.
It could look like this in practice:
- A vendor raises rates by 8%. The invoice gets approved because it’s within the approver’s threshold and the work was done.
- Another vendor adds a line item for a service outside the original agreement. It clears because no one flags it on review.
- A third vendor invoices at a higher unit rate than the contracted price. The amount is close enough to prior invoices that it doesn’t trigger an exception.
None of these are decisions. They’re approvals. By the time cost creep shows up as a budget variance, the pattern is months old and distributed across hundreds of individual approvals no one was watching in aggregate.
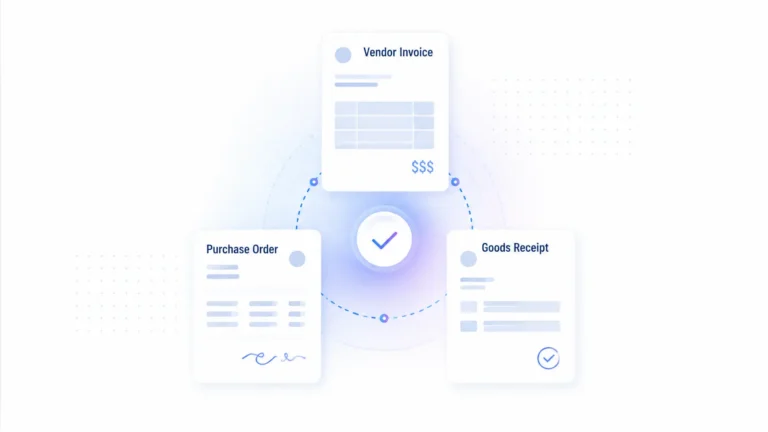
Three-way matching catches this for PO-backed purchases, but a significant share of AP spend never touches a PO. Service categories, recurring vendor relationships, and high-frequency engagements routinely bypass the PO workflow entirely. That’s where rate creep compounds undetected.
Sourcing Drift and GL Coding Drift
Cost creep gets the attention because it shows up in the budget. But there’s a quieter pattern compounding alongside it: the composition of spend itself is changing, and the GL coding that categorizes it may not be keeping up.
Sourcing drift
Vendor mix shifts period over period without a formal decision. A team starts routing work to a new vendor. A preferred supplier loses category share. Spend that used to concentrate in two or three vendors fragments across six. None of this triggers an alert because each invoice is coded and approved correctly on its own. The drift only becomes visible when someone compares this quarter’s vendor breakdown to last quarter’s, and most teams don’t do that at the invoice level.
This is a procurement problem you bring to the CFO.
GL coding drift
Expenses land in the wrong accounts. Not because of negligence, but because coding conventions shift over time, new vendor relationships don’t map cleanly to existing categories, or approvers default to the most recent code rather than the most accurate one. This affects financial reporting, audit readiness, and the reliability of variance analysis itself.
This is a controls and close integrity problem that gets escalated to internal controls or auditors.
Why the distinction matters
These two signals often get conflated. When they’re blurred together, controllers lose confidence in what the variance number actually means and where to route the finding.
Approvals vs. Spend Intelligence
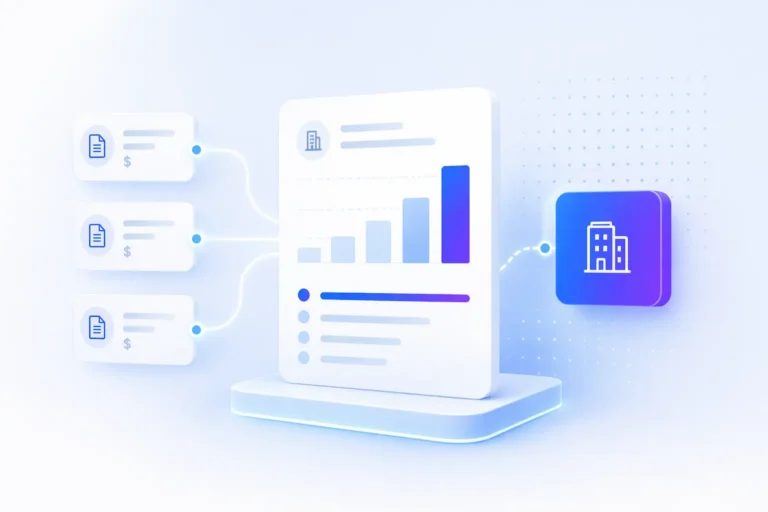
Accounts payable systems can capture vendor rates, approval chains, GL codes, payment terms, and line-item detail. That data is rich. The problem isn’t what’s being collected. It’s that most finance teams have no way to analyze it in aggregate across vendors, categories, and periods to surface what’s actually shifting.
Without that layer of analysis, patterns like these stay buried:
- A vendor’s average invoice value has increased significantly over the past year without a contract amendment.
- A category is running well above the prior period without a corresponding change in scope.
- Maverick spend is quietly driving the largest share of category overage.
- GL coding patterns have drifted enough to distort variance analysis itself.
The data is already there. Without that aggregate analysis layer, finance is forced to explain variance after the fact instead of validating spend before it posts.
What’s Already in Your Invoice Data
Stampli processes more than $150B in annual spend across its customer base. At that scale, the patterns are consistent: cost creep, sourcing drift, and coding drift show up across most organizations and spend categories. They rarely trace back to a single decision.
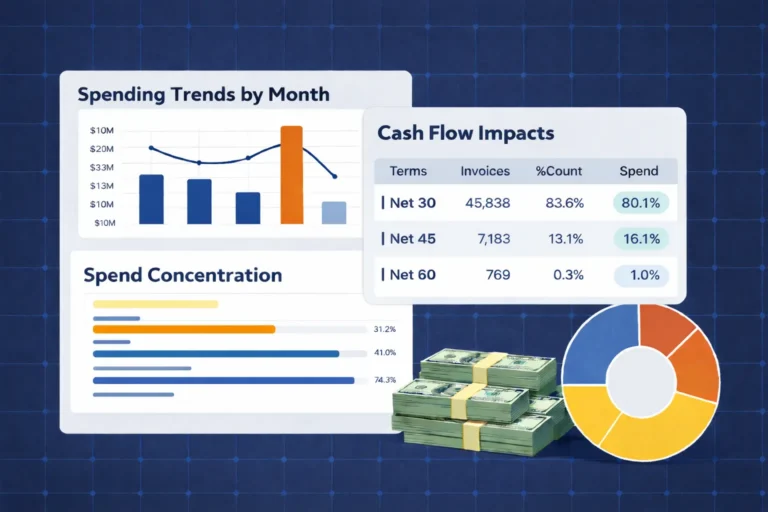
Stampli Deep Finance™ surfaces those patterns from invoice data already captured and validated withinERP-aligned workflows inside Stampli. Because the data is generated continuously through embedded AP and procurement workflows, Deep Finance can organize it into a focused, executive-ready Deep Finance analysis. For spend patterns, that analysis can surface signals like:
- Rate variance by vendor. Where invoiced amounts appear to have drifted above contracted or prior-period baselines, particularly in service spend where invoices move outside the PO workflow.
- Maverick spend. The share of category spend going to non-preferred or off-contract vendors, and what it may be costing relative to negotiated rates.
- Spend composition and GL coding shifts. How vendor mix and subcategory allocation have changed period over period, and whether the shift suggests a sourcing change, a coding problem, or both.
- Threshold clustering. Invoices that consistently fall just below approval thresholds, often a signal of spend being structured to avoid higher-level review, whether by a vendor, a requester, or both.
The output isn’t a data export or a dashboard. It’s a focused analysis with quantified findings, supporting evidence, financial impact, and recommended actions that a controller can bring into a leadership conversation with confidence.
The Conversation That Should Happen Sooner
Every quarter-end variance conversation follows the same script. The numbers don’t match. Someone needs to explain why. Finance works backward through months of transactions looking for a root cause that was never a single event.
The reason the answer comes late isn’t that teams are slow. It’s that the signals are scattered across invoices, vendors, GL codes, and approval records that no one is connecting in aggregate. The data exists, validated and structured within ERP-aligned workflows. The analysis doesn’t, until someone asks the question loudly enough to justify the manual effort.
Deep Finance changes when that conversation happens. Instead of reconstructing the story after the fact, finance leaders can surface rate creep, sourcing shifts, and coding drift while they’re still developing, when the findings are worth investigating rather than just explaining.
Your organization’s invoice data is already telling that story. Deep Finance turns it into action.
Want to see what these patterns look like in your own data? Explore Deep Finance.