Supplier Dashboard—How to Measure and Manage Supplier Performance
Are you looking for a better way for your team to keep suppliers updated and provide transparency across the organization?
Would you like to put relevant metrics into a convenient and reliable supplier dashboard?
Keeping a close eye on your suppliers while also keeping them happy (a.k.a. paid on time) is an underrated business practice. Growing companies rely heavily on their suppliers and vendors to keep their revenue graphs heading up and to the right, but many don’t have a way to really analyze supplier performance without slogging through tons of disparate data sets in different systems.
Creating a dashboard with a standard set of metrics also allows you to compare vendor performance apples to apples. Relationships are super important when it comes to working with suppliers, but relationships can’t be the only metric for the business relationship—having numbers to validate their performance is an absolute necessity.
In this post we’re going to take a detailed look at supplier dashboards including the basics, what metrics can go into them, and some tips on how to use one at your organization.
Let’s get started.
What is a Supplier Dashboard?
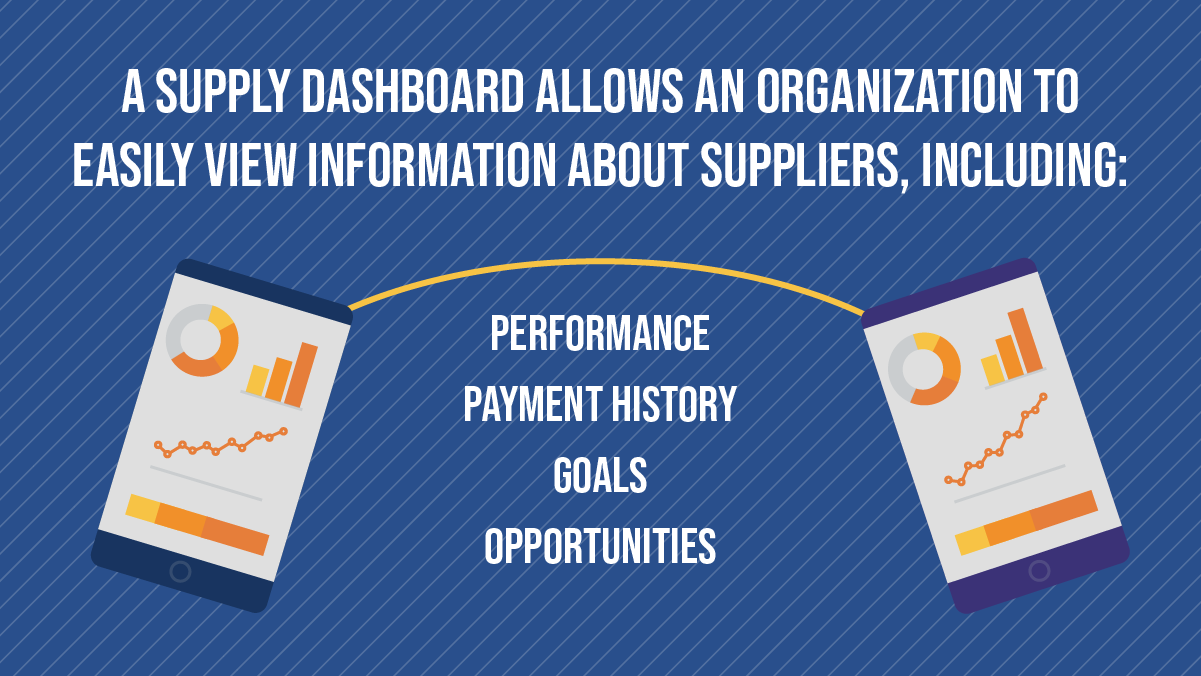
A supplier dashboard (also called a “vendor dashboard”) is an analytics tool used primarily by operations, procurement, supply chain, and finance teams. While every business will include different KPIs and provide different functionality in their dashboards, their purpose is almost universally the same: To provide comprehensive, easy-to-view data about supplier performance, history, and KPIs.
Supplier dashboards are important for any type of business that relies on vendors/suppliers because they help capture, store, and calculate performance metrics. This provides transparency in your operations and finance functions and a single source of truth for everyone involved (sometimes including suppliers) to operate from.
- Has that shipment been delivered? Check the supplier dashboard.
- Have we had any late deliveries in the last 3 months? Supplier dashboard.
- Can we find a way to speed up a process? You know where to look 🙂
There are several key benefits of maintaining an accurate supplier dashboard.
Identify issues – When the data is available for all to see, there shouldn’t be any questions about what the issue is. If something is late, it’ll show up in red letters (metaphorically or literally) in the dashboard. You can find the right person to try and get it resolved without playing too much phone tag.
Predict outcomes – In business, metrics are often connected. For example, non-payment can lead to non-delivery. If you’re reviewing data in your dashboard on a regular basis you’ll be able to take proactive measures before issues arise.
Improve communication – Why bother with a status call when both the supplier and the buyer can see all the information they need anytime they want? With the basics taken care of asynchronously, communication can be focused on more strategic initiatives.
Highlight opportunities – The capture, analysis, and communication of key data points between supplier and buyer can lead to better outcomes for both parties. The end result of that type of collaboration is a cycle of continuous improvement.
If you’re looking for one or more of these benefits at your organization, it might be time to consider using a supplier dashboard. Here’s a closer look at the inputs you need to collect and the steps you need to take to construct a custom supplier dashboard.
How to Build a Supplier Dashboard
There are lots of tools and templates for supplier dashboards that you can use to implement a supplier dashboard, but before you get into the tactics, we actually suggest taking a step back and look at the bigger picture. That said, let’s first look at what you want to get out of all this.
Step 1 – Set goals
What do you want to achieve with a supplier dashboard?
At a high level, everyone wants to measure the performance of their suppliers, but understanding what you’re going to do with that knowledge is also relevant. Often, companies will be looking to gauge performance of suppliers in order to open up competition, find cost savings, or identify areas of growth.
Whatever your endpoint is, make sure to set your goals according to the SMART goal-setting framework. And in order to track your progress on those goals, you’ll need metrics.
Step 2 – Identify metrics
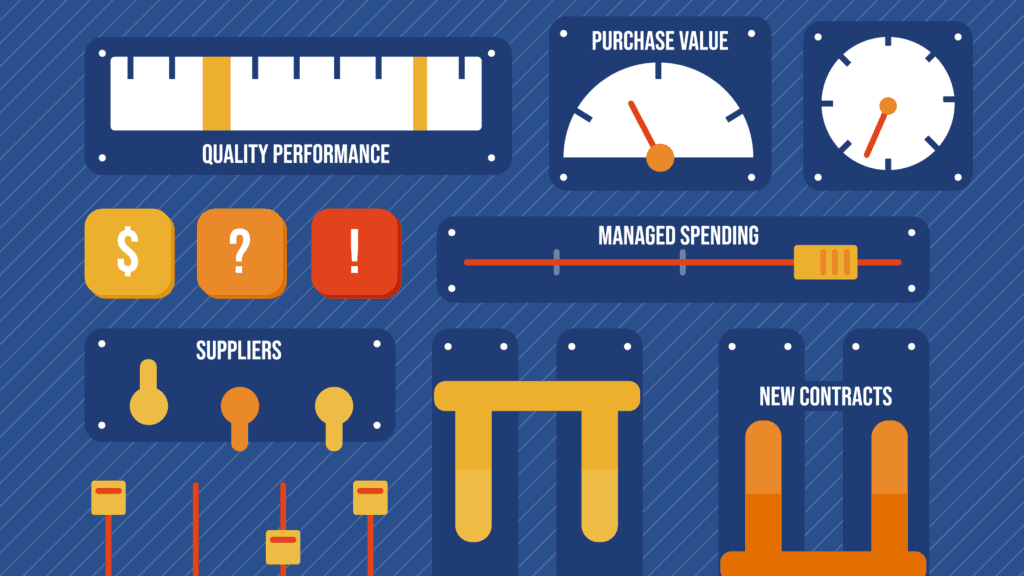
Finding the right balance of metrics is crucial—too few and you won’t know what’s really going on, but adding too many can cause information overload. Every organization is different, but here are a few commonly tracked metrics in many supplier dashboards:
- On-time deliveries
- Lead time on deliveries
- Suppliers managed
- Managed spending
- Price variances
- Meets purchase order requirements
- Quality of shipments
- Invoice processing errors/time to payment
Regardless of which metrics you decide to track and display in your supplier dashboard, you’ll want to make sure that all metrics are being drawn in real-time from their source. This is particularly true when looking at timely supply chain and financial info.
Additionally, note that many of these data sources can come from different departments and systems, which means you’ll have to synchronize them.
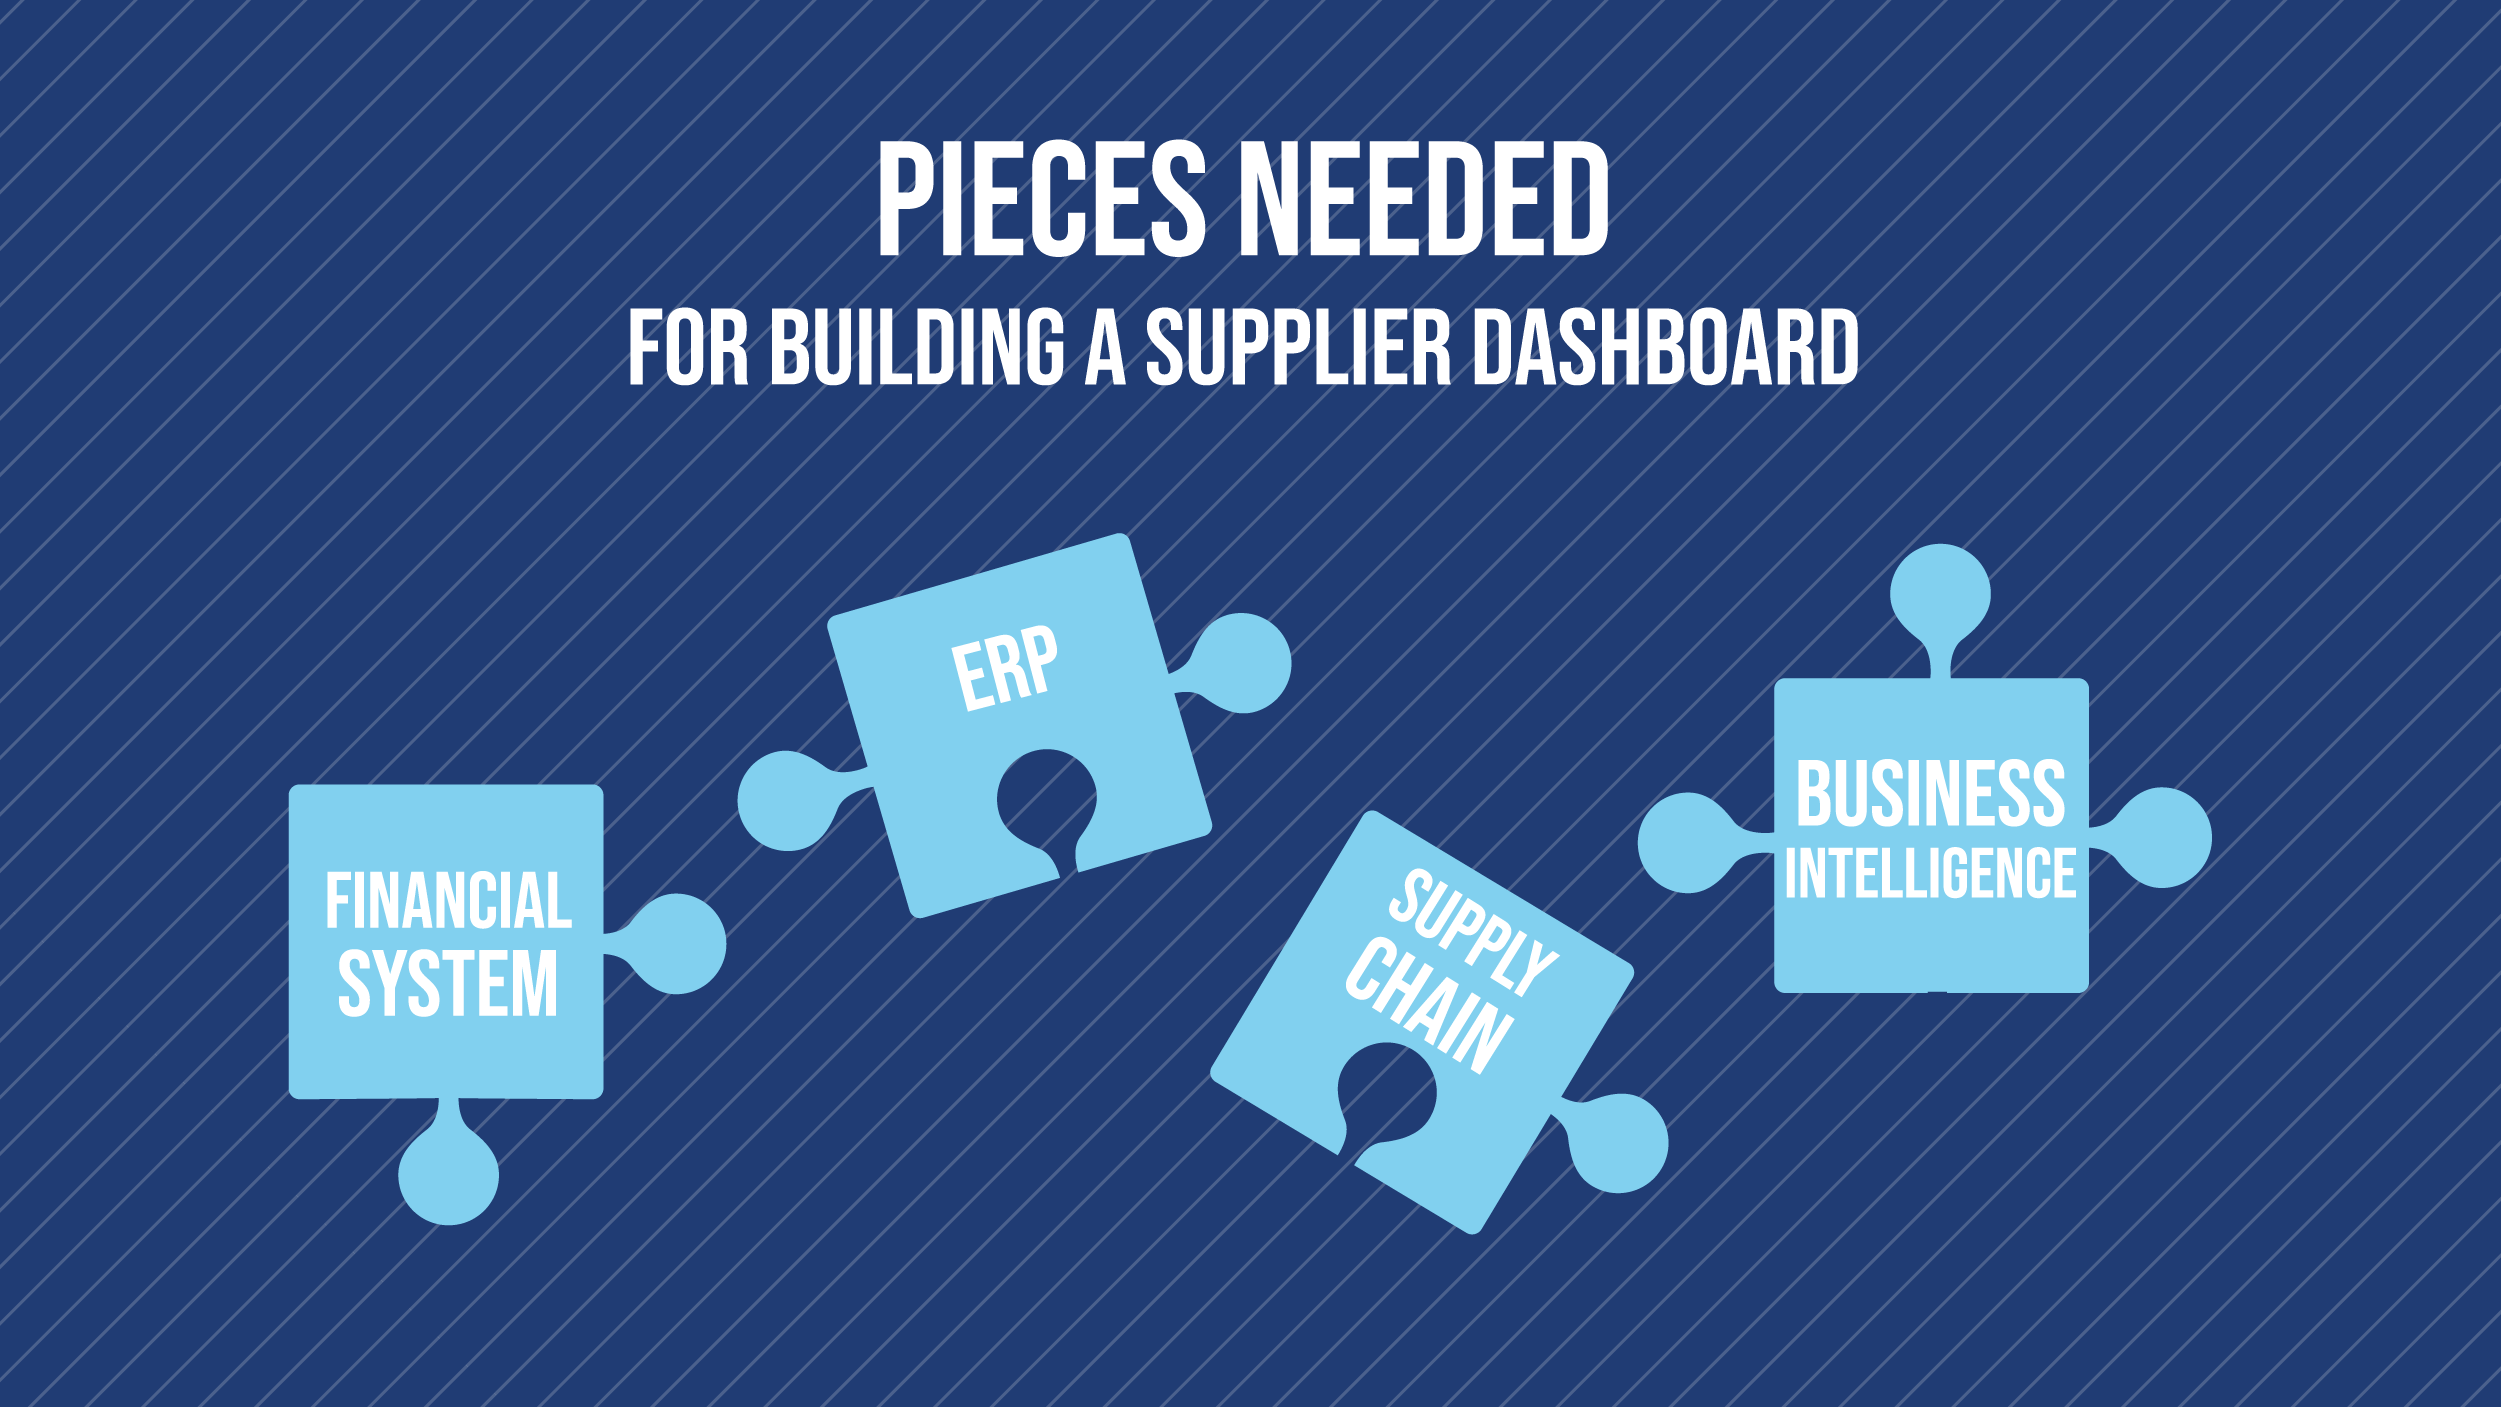
Step 3 – Integrate systems and configure dashboard
Depending on which metrics you choose to display, you’ll likely need to integrate the following systems at a minimum:
- Enterprise Resource Planning (ERP) system
- Financial system
- Business intelligence system
While you could technically build a massive spreadsheet to house all your data—and perhaps configure it with some fancy macros to help with data visualization—you’re likely going to want to implement some type of reporting software designed specifically for this purpose. Finding one that’s tailored to your industry and comes with integrations for your existing technology stack is a major benefit.
Additionally, depending on your role, you may need to parse the data in different ways. For example, you may want to look at a snapshot of current late deliveries to help you put out a fire, or you may want to look at several months of history of late deliveries to analyze trends and performance. Most software designed for this purpose will allow you to slice and dice the data to suit your perspective.
Step 4 – Determine access levels
Another major benefit of using software that’s specifically designed for reporting is that you can configure different levels of access for both internal and external stakeholders. You can provide alternate ‘views’ that provide need-to-know info appropriate at the employee or company level.
As we mentioned earlier, you may want your suppliers to have access to some information, but likely not all.
For instance, let’s say you’re tracking late deliveries. It probably makes sense to transparently display late delivery metrics in an area a supplier can access. If your dashboard also provides a score or grade for that metric, perhaps that’s something that’s best for internal eyes only.
Think about who would need to see which data sets and why, then configure your dashboard appropriately.
Follow these four steps and you’ll be well on your way to a supplier dashboard that will help drive data-backed business decisions, save you time and money, and improve communication with your suppliers or vendors.
As we mentioned earlier, most supplier dashboards will require at least some financial information to be included. Examples of these items might be invoices, business-to-business (B2B) payments, average time to payment, discounts, and other metrics from within the accounts payable department.
At Stampli, we’ve long held the view that a fully optimized AP department can help enhance your vendor relations through on-time (or early!) payments, transparency, and communication. This is why our AP automation platform comes with a vendor portal where your suppliers can view their bill status and send questions. No internal information such as coding, comments, or processes is shown in the vendor portal. The portal is designed to improve the vendor management process (invoice approvals and payment management) and keep track of all related metrics. And of course, all data is presented in real-time and available 24/7 for easy access.
If you have questions about how financial data fits into your supplier dashboard or would like to chat about anything related to accounts payable, schedule a call with one of our AP Heroes today!